Dow Theory: 6 Basic Tenets
1. The Averages Discount Everything: The idea that the markets reflect every possible knowable factor that affects overall supply and demand is on the basic premises of technical theory. The theory applies to market averages, as well as it does to individual markets, and even makes allowances for “acts of God.” While the markets cannot anticipate events such as earthquakes and various other natural calamities, they quickly discount such occurrences, and almost instantaneously assimilate their affects into the price action.
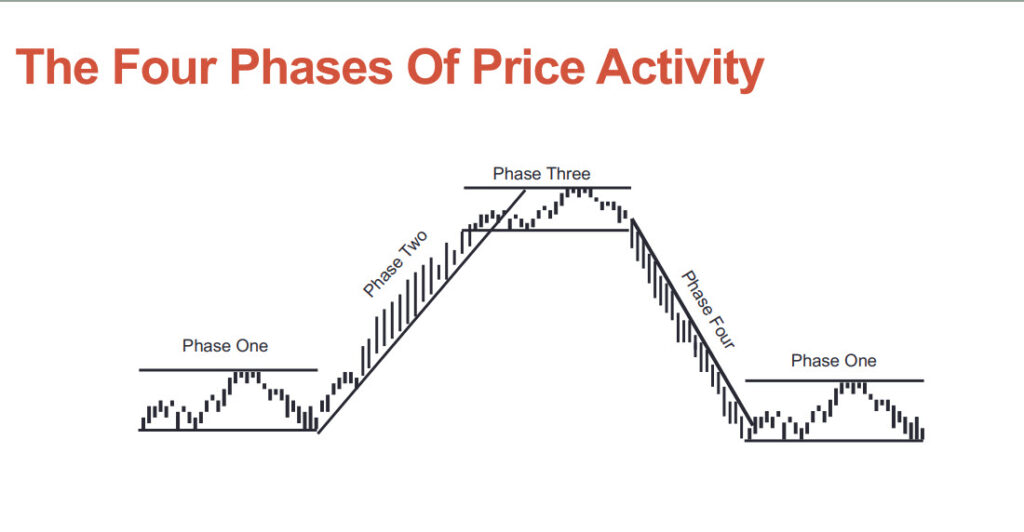
2. The market Has Three Trends: Dow defined an uptrend as a situation in which each successive rally closes higher than the previous rally high, and each successive rally low also closes higher than the previous rally low. In other words, an uptrend has a pattern of rising peaks and troughs. The opposite situation, with successively lower peaks and troughs, defines a downtrend. Dow’s definition has withstood the test of time and still forms the cornerstone of trend analysis.
Dow believed in that the laws of action and reaction apply to the markets just as they do to the physical universe. He wrote, “Records of trading show that in many cases when a stock reaches top it will have a moderate decline and then go back again to near the highest figures. If after such a move, the price again recedes, it is liable to decline some distance” (Nelson, page 43).
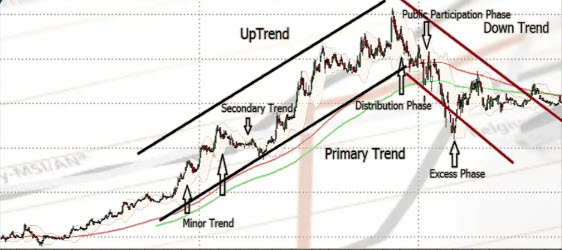
Dow considered a trend to have three parts, primary, secondary, and minor, which he compared to the tide, waves, and ripples of the sea. The primary trend represents the tide, the secondary or intermediate trend represents the waves that make up the tide, and the minor trends behave like ripples on the waves.
An observer can determine the direction of the tide by noting the highest point on the beach reached by successive waves. If each successive wave reaches further inland than the preceding one, the tide is flowing in. When the high point of each successive wave recedes, the tide has turned out and is ebbing. Unlike actual ocean tides, which last a matter of hours, Dow conceived of market tides as lasting for more than a year, and possible for several years.
The secondary, or intermediate, trend represents corrections in the primary trend and usually lasts three weeks to three months. These intermediate corrections generally retrace between one-third and two-thirds of the previous trend movement and most frequently about half, or 50%, of the previous move.
According to Dow, the minor) or near term) trend usually lasts less than three weeks. This near-term trend represents fluctuations in the intermediate trend.
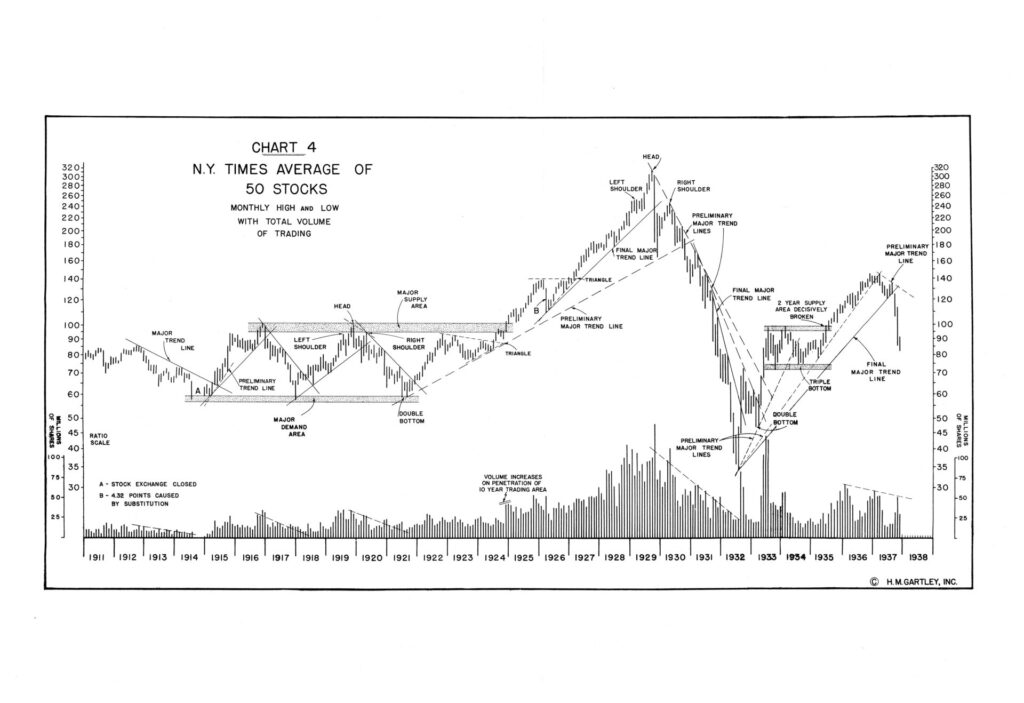
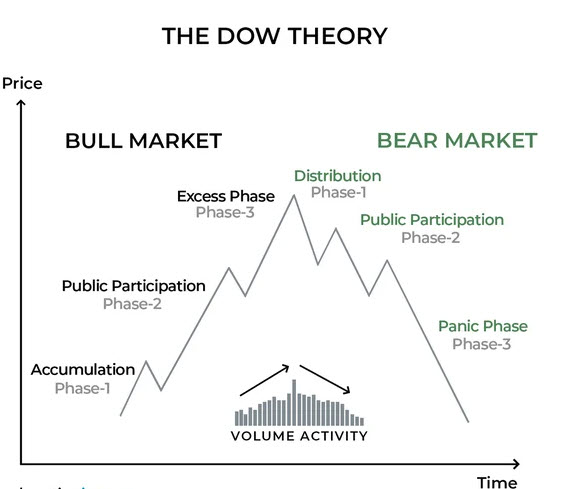
3. Major Trends Have Three Phases: Dow focused his attention on primary or major trends, which he felt usually take place in three distinct phases: accumulation phase, a public participation phase, and a distribution phase. The accumulation phase represents informed buying by the most astute investors. If the previous trend was down, then at this point these astute investors recognize that the market has assimilated all the so-called “bad” news. The public participation phase, where most technical trend-followers begin to participate, occurs when prices begin to advance rapidly and business news improves. The distribution phase takes place when newspapers begin to print increasingly bullish stories; when economic news is better than ever; and when speculative volume and public participation increase. During the last phase the same informed investors who began to “accumulate” near the bear market bottom (when no one else wanted to buy) begin to “distribute” before anyone else starts selling.
Students of Elliott Wave Theory will recognize this division of a major bull market into three distinct phases. R.N. Elliott elaborated upon Rhea’s work in Dow Theory, to recognize that a bull market has three major, upward movements.
4. The Averages Must Confirm Each Other: Dow, in referring to the Industrial and rail Averages, meant that no important bull or bear market signal could take place unless both averages gave the same signal, thus confirming each other. He felt that both averages must exceed a previous secondary peak to confirm the inception or continuation of a bull market. He did not believe that the signals had to occur simultaneously, but recognized that a shorter length of time between the two signals provided stronger confirmation. When the two averages diverged from one another, Dow assumed that the prior trend was still maintained. (Elliott Wave Theory only requires that signals be generated in a single average.)
5. Volume Must Confirm the Trend: Dow recognized volume as a secondary but important factor in confirming price signals. Simply stated, volume should expand or increase in the direction of the major trend. In a major uptrend, volume would then increase as price move higher, and diminish as prices fall. In a downtrend, volume should increase as prices drop and diminish as they rally. Dow considered volume a secondary indicator. He based his actual buy and sell signals entirely on closing prices. Today’s sophisticated volume indicators help determine whether volume is increasing or falling off. Savvy traders then compare this information to price action to see if the two are confirming each other.
6. A Trend Is Assumed to Be in Effect Until It Gives Definite Signals That It Has Reversed: This tenet forms much of the foundation of modern trend-following approaches. It relates a physical law to market movement, which states that an object in motion (in this case a trend) tends to continue in motion until some external forces causes it to change direction. A number of technical tools are available to traders to assist in the difficult task of spotting reversal signals, including the study of support and resistance levels, price patterns, trendlines, and moving averages. Some indicators can provide even earlier warning signals of loss of momentum. All of that notwithstanding, the odds usually favor the existing trend will continue.
The most difficult task for a Dow theorist, or any trend-follower for that matter, is being able to distinguish between a normal secondary correction in an existing trend and the first leg of a new trend in the opposite direction. Dow theorists often disagree as to when the market gives an actual reversal signal.
Source: Murphy, John. Technical Analysis of the Financial Markets; (c) 1999.