January 31, 2022 Recording of our panel discussion on the stock market, S&P 500, SPY, SPX and other symbols for trading.
⏰ Watch: Crowd Forecast News Episode #329
Recorded: 01/31/2022 at 1PM ET
Duration (video): 61 minutes
Duration (podcast): 59 minutes
This video is a short tutorial on the trading pattern – The Butterfly reversal pattern. Traders can apply this pattern day trading, swing trading, or to longer term analysis. Watch this 5-minute video from Trading Live Online!
SPECIAL INVITATION – Monday, January 10, 2022 1 PM ET.
I’ll be a guest on the panel discussion for TimingResearch’s Crowd Forecast News Show Recorded Live at 1 PM ET.
Markets had an explosive down move with the first week of trading in 2022. I’ll discuss my analysis and the current trade setups in the major Indexes.
Make sure to register even if you can’t join to receive the recording!
CLICK Link TO REGISTER AND RECEIVE THE RECORDING
https://xs224.isrefer.com/go/cfnreg/tradingliveonline/
You are invited to the LIVE recording of the next episode of Crowd Forecast News, this coming Monday. For over 7 years now, the CFN series on TimingResearch has been helping traders start their week out with the best possible edge in the markets.
https://xs224.isrefer.com/go/cfnreg/tradingliveonline/
On this episode, the panel of experts will start out with their forecast for the S&P 500, then move on to talk about the stocks, strategies, economic announcements or anything else important that they expect to happen that traders need to know to start their week off right.
Episode Title:
Crowd Forecast News #327
LIVE Recording Date and Time:
– Monday, January 10, 2022
– 1 PM ET (9AM PT)
-Please join me, Leslie Jouflas, CMT of www.TradingLiveOnline.com
Click here to learn more and sign up!
The panel will discuss each of the expert traders’ thoughts on coming market conditions. You’ll gain an edge that is unseen by the general public.
If you can’t attend live, got ahead and register anyway and we’ll send you the archive as soon as the episode is ready…
Best Wishes for Successful Trading!
Excerpted from ‘Trade What You See, How to Profit From Pattern Recognition’Authors Larry Pesavento and Leslie Jouflas
My good friend and trading buddy Jim Twentyman brought the concept of harmonic numbers to my attention. Jim had taken a sabbatical to study the works of WD Gann. He labored more than 12 months into the works of the legendary trader. Jim was very intrigued by the number 54. Intrigued was an understatement! To this day, Jim has never told me the significance of 54 and this is a man who has shared everything with me. I know that it is a metaphysical number but the exact meaning is still unsure with me.
Harmonic numbers are numbers that occur over and over again on a chart. They can be found easily by examining 30-minute charts over a 30-day period. Statistically, you need 100 samples to get one valid harmonic number. After a hundred samples one swing will appear prominent. All the swings on the 30-minute chart will relate to the harmonic number by the ratios we use; .618, .786, 1.00, 1.27, 1.618, 2.00, etc. Once this number is ascertained it can help you in trading several different ways. First, it can act as the first profit objective. Second, it can act as a maximum stop loss on a trade.
Harmonic numbers are one of the more difficult concepts to grasp (much like the opening price principle) but once you see how they can be applied the mystery becomes the trader’s friend.
Markets vibrate up, down, and sideways all the time. They repeat this pattern for all eternity. Think of the market as a giant tuning fork that vibrates constantly. Once a trader discovers this vibration he has an edge over the market, albeit a small one. But it is still an edge just the same! Study the harmonic numbers of your favorite stocks and commodities. It will pay dividends as time goes by!
Here is the primary harmonic number for the S&P 500. This started on the first day of trading, April 16th, 1981 (Elvis’ death). It has remained this all along.
540 x 1.27 = 685
540 x 1.618 = 8.70 (8 pt stop)
540 x 2.00 = 1080
Minimum contraction in S&P 500 is 350. 350 is .618 of 540.
Use these #’s to take profits and use them for maximum stop protection!
Please feel free to visit the website www.tradingliveonline.com for more information on our trading courses.
Contact me directly at [email protected] for information on my one-on-one training to help you with your success!
Best wishes for successful trading!
Leslie Jouflas, CMT
Excerpted from Essentials of Trading, It’s not WHAT You Think – It’s HOW You Think. Authors Larry Pesavento and Leslie Jouflas
It is a given that traders cannot win 100 percent of the time, because with reward comes risk, and losses are as much a fact of life as taxes and death. But there are highly valuable lessons to be learned about the trading process that go far beyond the dollar signs. How traders put reliable steps in place to ensure that their performance may be enhanced on the road to success is critical. For most success is dependent not only on what is done correctly but also on what potentially havoc-wreaking mistakes can be avoided and/or corrected.
There are three principles that can aid in anticipating and possibly avoiding mistakes, they are;
- Probability
- Self Discipline
- Responsibility
Probability; Trading is all about probabilities and while every trader encounters a losing streak or draw down of equity, success as a trader is measured by how well losses are handled mentally. A sure sign of potential disaster is holding large losses in open positions while at the same time taking many small profits. A trader mentally dupes himself into believing that the small profits will offset the large losses. This is working against probabilities and a winning strategy.
Most losing streaks are the result of probability distribution. As an example, in 100 trades a system should encounter a losing streak of up to eight trades in a row. This is usually the time the trader begins to question the validity of the system. It is also the worst time to stop trading; the trader must continue to follow his methodology, because it has been shown that winning streaks generally follow losing streaks.
Traders must train themselves to think in terms of probability for three very important reasons:
- No one knows with 100 percent certainty whether the trade will be profitable or not.
- No one knows how much money will be made or lost on a trade.
- If the trader does not control the profit outcome and does not know with 100 percent certainty which trade will work, then the trader should spend 100 percent of his time concentrating on the only element of the trade he can control – the risk.
Take care of your losses and your profits will take care of themselves. This is sage advice from Amos Barr Hostetter of Commodity Corporation.
Self Discipline; Trading is all about discipline; discipline to take the trade and more importantly to take the loss when necessary. If you possess the necessary discipline to follow a profitable methodology it can lead you to freedom – the freedom to make as much money as you need, work at a profession you love, and the freedom to do what you want to do!
Discipline is a two part process:
- Preparation
- Execution
Preparation covers several aspects, such as mental preparation; thinking through what risks are present in the trade, knowing how to get out of the trade – this is very important. Getting in most times is much easier than getting out. It has been said that it is better to be out of a trade wishing you were in – than in a trade wishing you were out.
When the markets are closed, that is the time to prepare your self mentally for trading. You want to avoid making compulsive trading decisions while the market is moving. Your preparation prior to the market open should consist of your trading plan for that trading day.
We suggest not consuming alcohol during the trading week and getting adequate rest is important to preparing yourself mentally for trading and eating a healthy diet along with physical exercise. These will all contribute greatly to trading successfully and should be part of your personal discipline.
The execution part of discipline involves preparation for the actual trades, doing the technical analysis work or the fundamental work. Knowing what you are going to trade requires homework.
We are pattern recognition traders and routinely follow various stocks, futures and commodities. Each pattern we trade has its own probability of success and each pattern has its own measurement of risk control. You must have a plan for executing your trades and be able to follow that plan.
The mixture of the execution process is risk control and profit protection. Finely tuned execution skills are going to account for a great percentage of success in trading.
Risk is the only thing we can control in the trading process. We can never know which trades are going to work or how much we will make on a trade. Profit protection requires monitoring the price action in order to reduce risk as soon as possible. Once a trade begins to work, it is good money management to take steps to reduce risk in the trade. If you control your risk the probability of getting a winning streak is increased. If you don’t control your risk, the probability of ruin is certain.
Maintaining routines can be very helpful in developing discipline in trading. Every trader develops different routines they follow, but they should always include ample time for preparing mentally and technically for the next trading day. Another benefit to having a trading routine is that it will help re-center you when your trading is off or you are going through external pressures. We would strongly recommend doing some type of chart work by hand, this is a great part of a trading routine as it helps the trader recognize patterns and opportunities.
Responsibility; in trading this can not be emphasized enough. The trader must have an attitude that they take responsibility for their trading. The markets are not responsible, the brokers are not responsible, the computers are not responsible, only the trader. Once the trader adopts this attitude setbacks will be much easier to deal with. Of course the unexpected can and will occur in trading, but you must learn to take it in stride and go forward. Trading requires the ultimate characteristic trait of responsibility because markets are like a river and we have to jump in to be involved. Once we are in the grasp of the market and all of its forces only you can save yourself.
One excellent way to take responsibility for your trading is to keep a trading journal. The journal can review the days trading and set a plan for the next day, address trading errors with solutions and also record successful patterns from winning trades.
Probabililty, discipline and responsibility are all elements that go hand in hand with each other in trading. They each have many different levels and aspects that can aid a trader on his journey to success.
Originally published in Bombay Stock Exchange Brokers Forum (BBF) Mumbai, India April 2021 Volume 10 – Issue NO.1
H.M Gartley published his classic book on technical analysis in 1935, ‘Profits in the Stock Market’. The book was a course in trading and sold for $1500 to investors. The book is 446 pages and includes a packet of reproduction charts hand-drawn from the 1800s to 1935.
It is a treasure for any technical analyst or student of the financial markets as a reference book in their trading library.
On page 249 Gartley describes a chart pattern, “Practical Use of Trend Lines”.

Chart 1 – Upward Sloping Parallel Trend Line Channel
Within a Parallel Trend Line Channel, the AB=CD pattern is formed by price rallies and declines bound within an upper and lower trend line. These patterns can be up sloping, downsloping or horizontal.
The swings are labeled A, B, C, D, E, F in the illustration. This is the basis of the AB=CD trading pattern.
(See Chart 2)
H.M. Gartley never used or referred to specific Fibonacci ratios, however, he did refer to retracements in terms of one-third, two-thirds, or one-half.
The AB=CD pattern is the root pattern of the Gartley 222, Butterfly, and is also found in the 3 Drives pattern.
It is imperative that traders learn and study the correct structure and variations of this pattern before learning the other patterns mentioned.
In 1976 Larry Pesavento was the first trader to implement Fibonacci ratios and apply them to the AB=CD and Gartley 222 pattern, which is a retracement pattern containing the AB=CD pattern.
The Fibonacci ratios and extension ratios bring structure to the identification of these patterns and can be valuable in identifying failed or invalid patterns. The pattern has the shape of a “Lightning Bolt”, remembering this shape will help traders study this pattern on price charts.
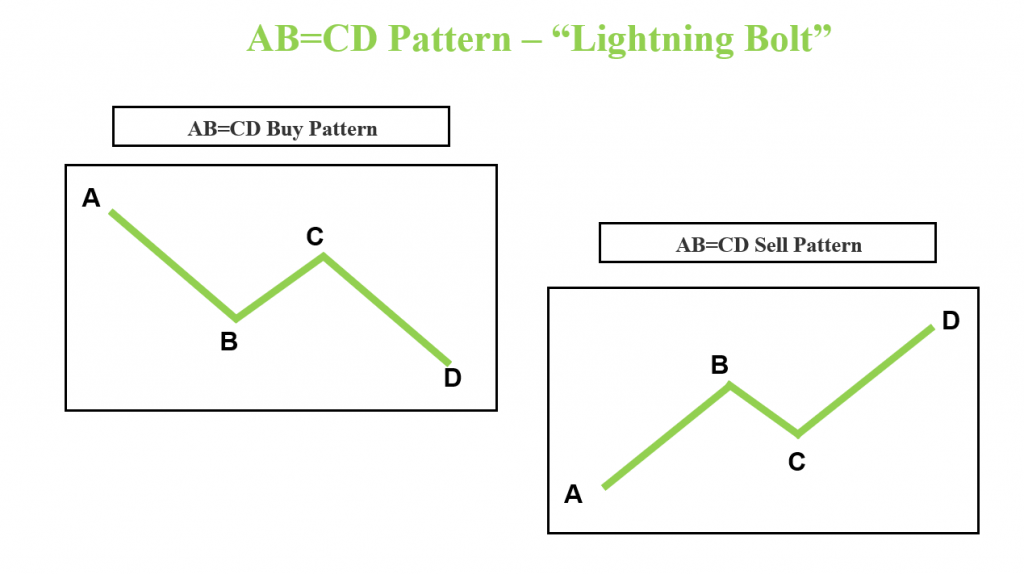
Chart 2 – Line Drawing Example of AB=CD Buy Pattern and AB=CD Sell Pattern
AB=CD Structure
The AB=CD pattern forms in all markets and all time frames. There are three waves (legs) that form this pattern;
- Wave 1 is labeled A-B
- Wave 2 is labeled B-C
- Wave 3 is labeled C-D
After the completion of the first leg (A-B) a retracement or corrective wave will form (B-C) and can retrace within a range of the A-B leg from .382, .50, .618, .786, .886, and even to the 1.0 of the A-B wave. Please note, a B-C retracement that exceeds the A point will invalidate the pattern.
Often the A-B and the C-D legs will be equal in length. However, a variation of the C-D leg can be extended and be longer than the A-B leg. These are the Fibonacci ratios I use most frequently for the CD leg extensions:
- 1.27
- 1.618
There are times that the C-D leg extension will exceed 1.618 but generally beyond the 2.0 extension (2 times the length of A-B) is considered an invalid pattern structure.
Chart 3 below shows an example of the Fibonacci retracements and the Fibonacci extension ratios of the C-D leg.
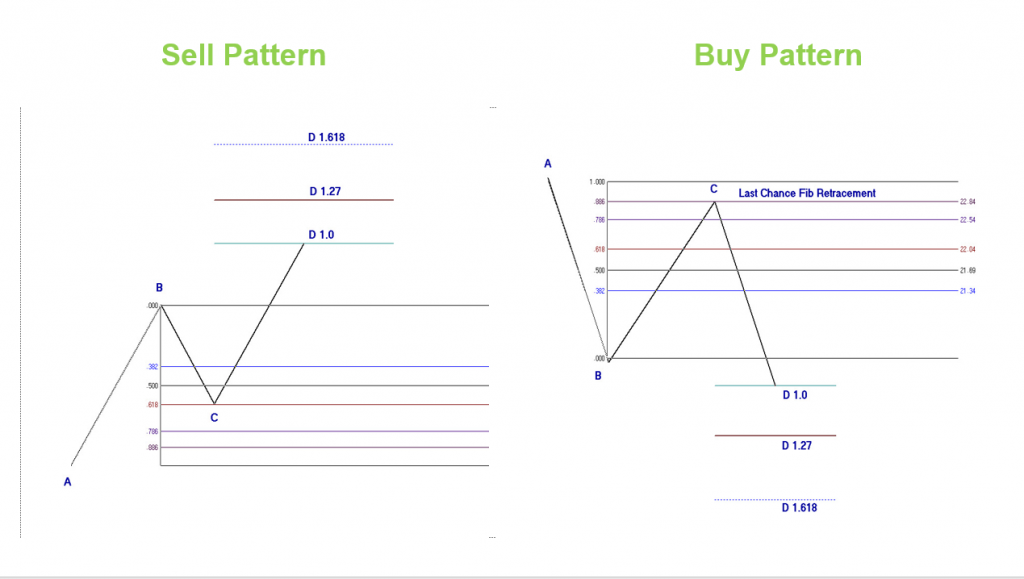
Chart 3 – Example of Fibonacci Retracement Ratios and Fibonacci Extension Ratios
I refer to the .886 retracement level as the “Last Chance Fib Retracement”. Generally, when a market has a close beyond the .886 it will move to the 1.0 or further. It is the “Last Chance” for the market to complete the correction and move in the opposite direction.
Although the 1.0 is considered valid as a retracement, most technical analysts will recognize this as a double top or double bottom pattern. This should be kept in mind when analyzing a potential AB=CD pattern that has a retracement at this level. The market should then be monitored for strength or weakness from that retracement.
Calculating the Fibonacci Extension Ratios
My charting tool, provided by Ensign Software, will project the Fibonacci retracement and extension ratios as a pattern is forming. This way I can monitor the pattern as it forms and be aware of the potential completion areas. I refer to a C-D leg that is equal to the A-B leg as the 1.0 completion. For C-D legs that extend to a 1.27 or 1.618, I refer to those as;
- 1.27 D completion point
- 1.618 D completion point
If you have a Fibonacci tool that you can input those ratios you will be able to use that to find those completion points. It is an easy calculation to find the C-D Fibonacci extensions and is as follows;
To find the 1.27 Fibonacci extension ratio take the length of A-B and multiply by 1.27. Add to the low of C for a sell pattern and subtract from C for a buy pattern.
- A-B = 10 points
- 10 points x 1.27 = 12.7
- Add 12.7 to the low of C (Sell pattern) or subtract from high of C (Buy pattern) = projected 1.27 D completion
The same calculation can be used for a 1.618 D completion point.
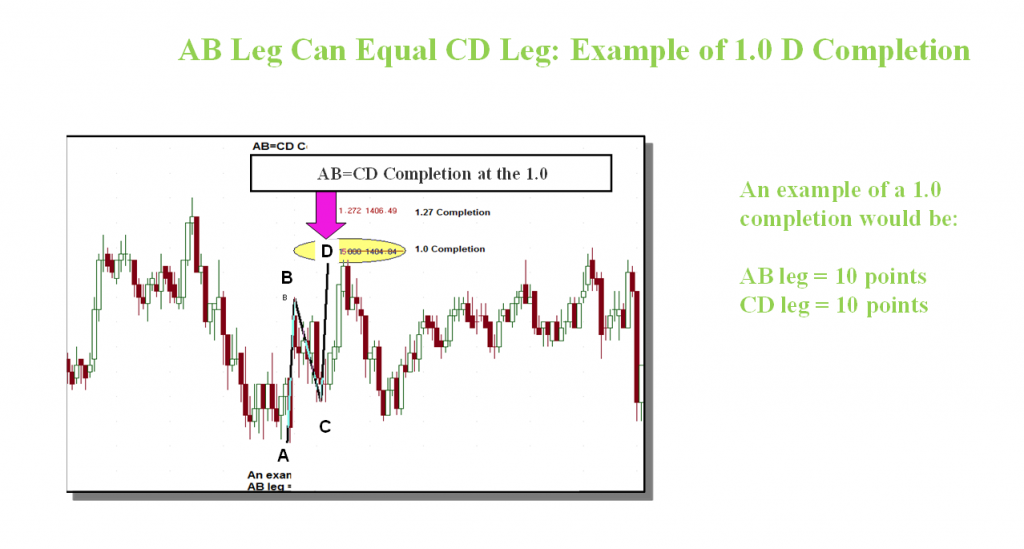
Chart 4 – Example of 1.0 D Completion
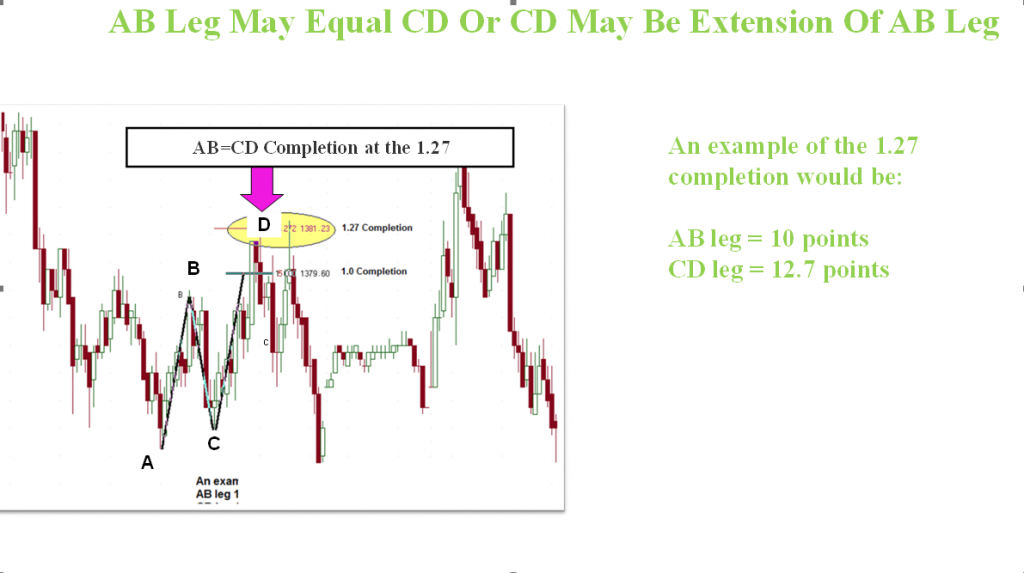
Chart 5 – Example of 1.27 D Completion
Calculating the B-C leg extension can also be helpful in determining confluence into the C-D leg pattern completion areas. It is calculated using the same method as discussed above.
Chart 6A below is an example of the AB=CD pattern drawing and labeling of ratios.
Chart 6B below is another example showing the Fibonacci retracements, extension ratios, and the B-C extension. Note also in Chart 6B the Parallel Trend Line Channel discussed earlier in this article.
Using the first pattern on the left you will see the B-C extension ratio labeled 1.27.
Length of B-C x 1.27 added to the low of C.
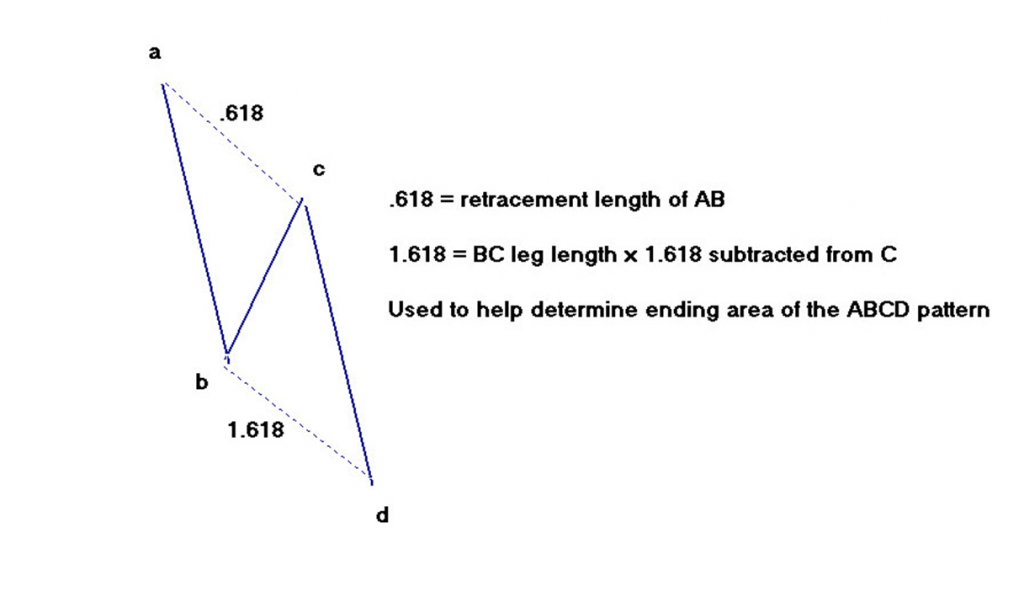
Chart 6A – Example of AB=CD Buy Pattern Labeling
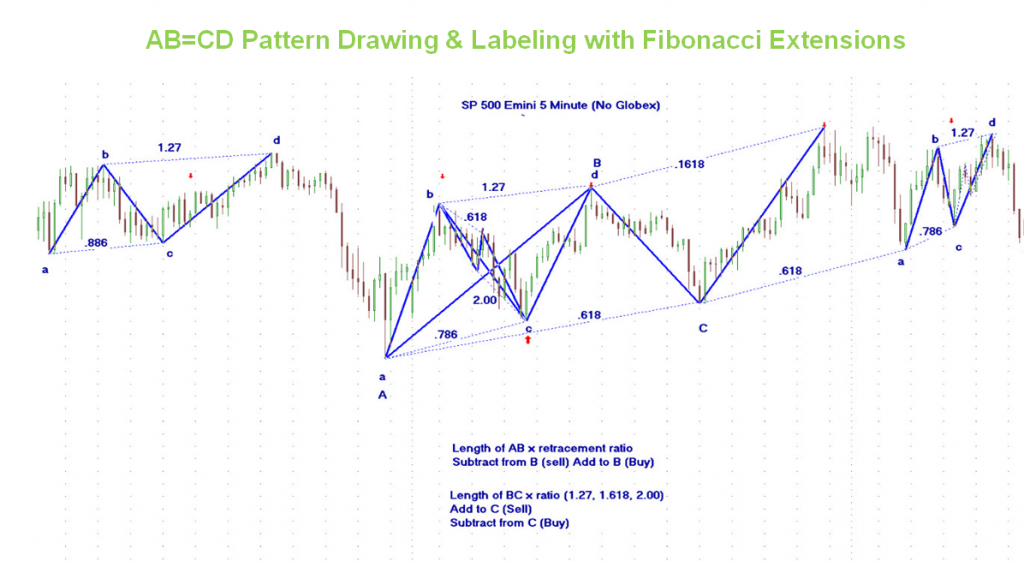
Chart 6B – Examples of B-C Fibonacci Extensions and Parallel Trend Line Channel
Symmetry, Pattern Invalidations and Warning Signs
Symmetry is important to study with the AB=CD and the other related patterns. The symmetrical or asymmetrical formation of the A-B and C-D legs can be clues. (See Chart 7 below)
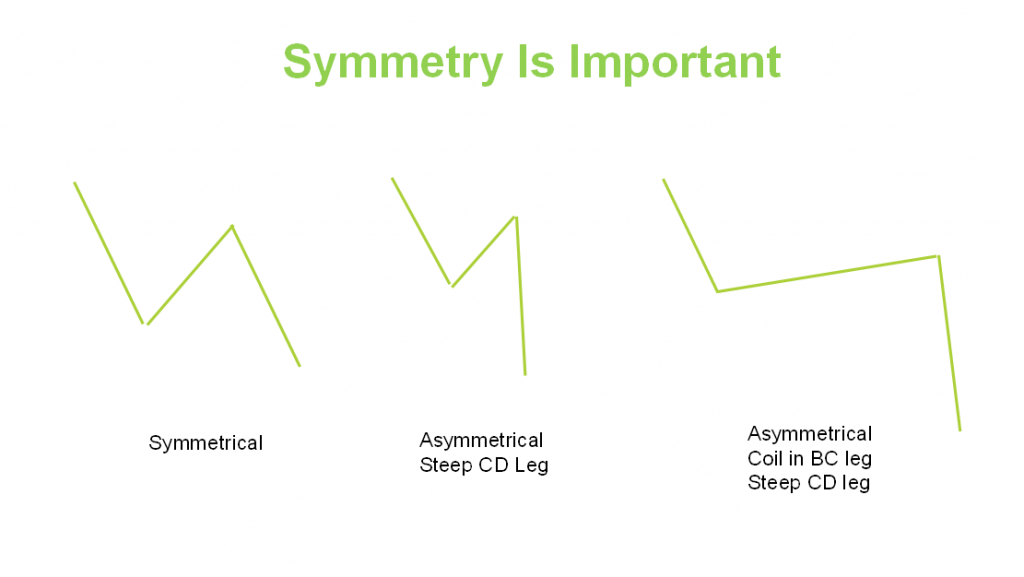
Chart 7 – Illustration of Symmetrical versus Asymmetrical Pattern Formations
In general the A-B and C-D legs should be similar in slope and angle. Long, wide-ranging bars that form in the C-D leg can be an indication that a stronger move is in progress and that a trend may be in progress.
The long, wide-ranging bars can also indicate the price may complete at one of the Fibonacci extension ratios discussed earlier.
Chart 8 below shows an example of an asymmetrical C-D leg compared to A-B. Also, note the long coil formation in the B-C leg.
The C-D leg clearly shows long, wide range bars at a steeper slope and angle than the A-B leg.
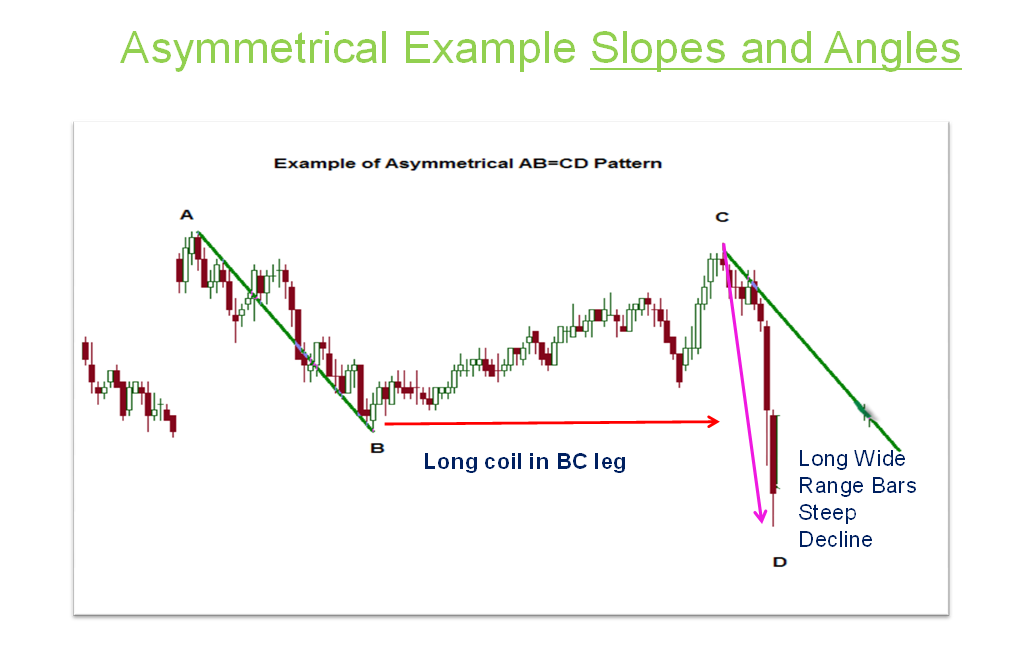
Chart 8 – Example of Asymmetrical Slope and Angle with Long Wide Range Bars
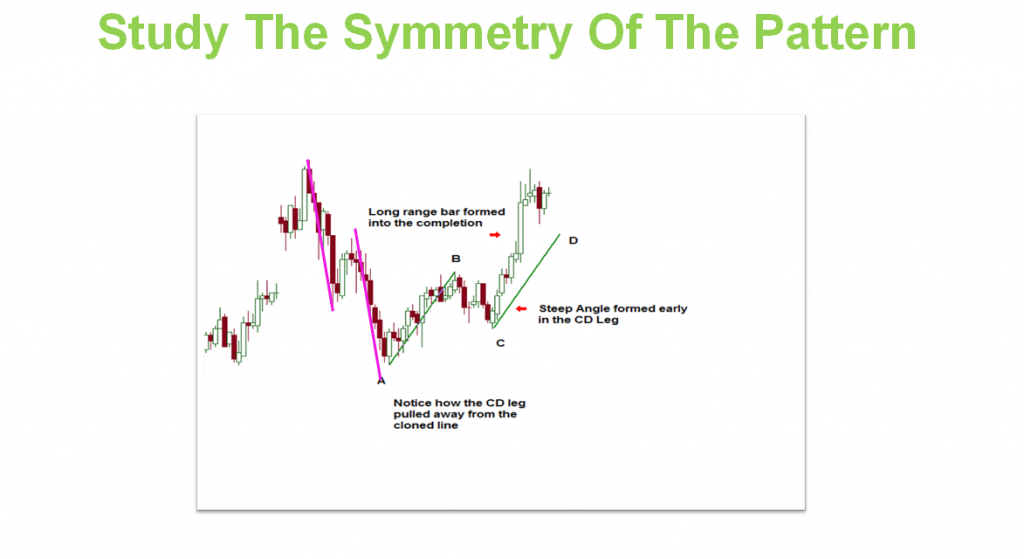
Chart 9 – Example of Steep Slope and Angle C-D Leg
Time symmetry is another element in the structure to study. This is covered more in-depth in my course listed at the end of this article. However, briefly, there should be approximately the same number, or ratio, of bars in the A-B and C-D legs.
See chart 10 and chart 11 below for examples
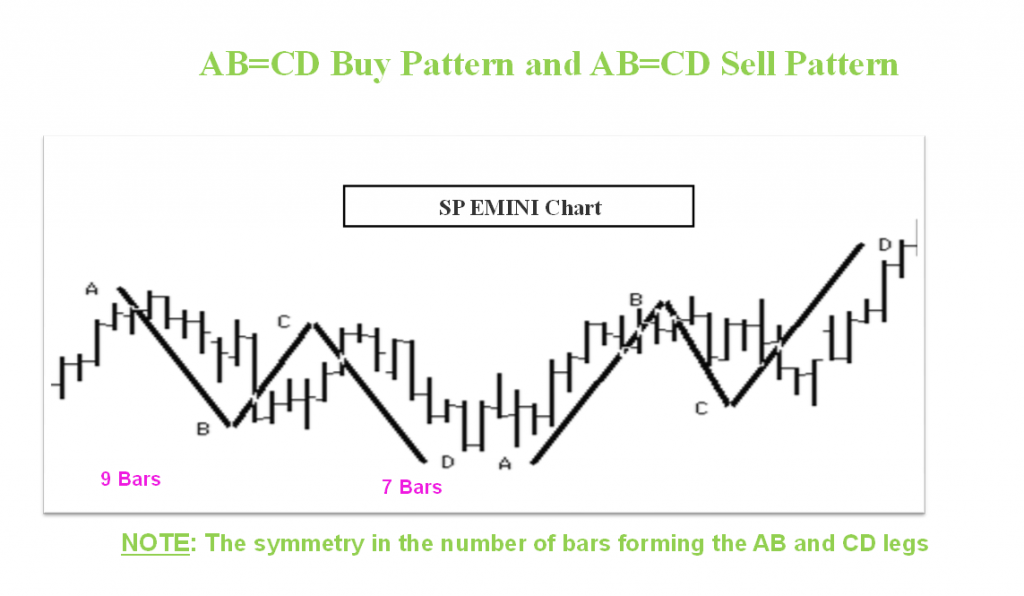
Chart 10 – Example of Time Symmetry
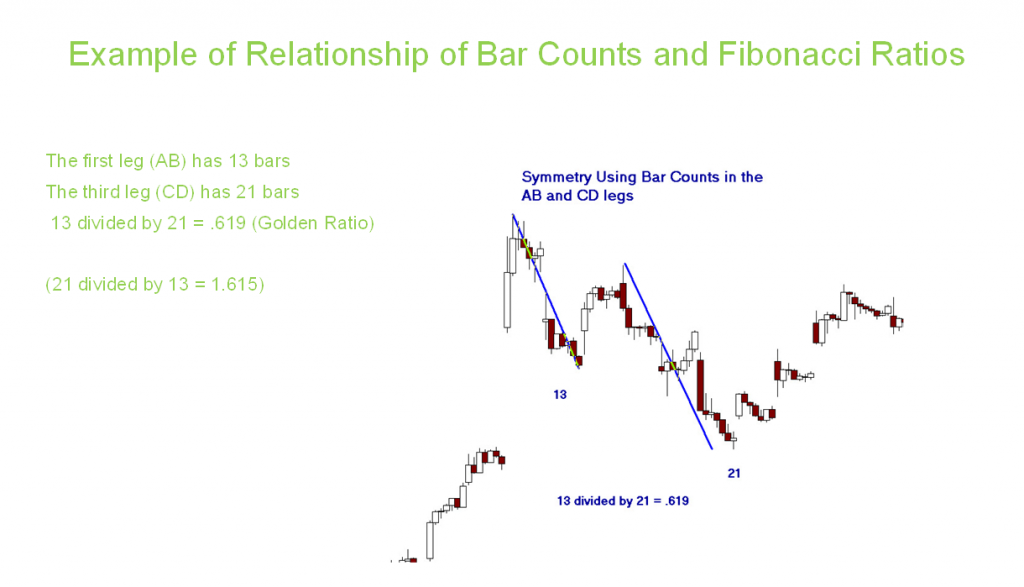
Chart 11 – Example of Time Symmetry and Fibonacci Relationship
Pattern invalidations
There are several main items that may invalidate the AB=CD pattern structure. It takes time and chart study to recognize these as part of a pattern formation and know when to avoid the pattern.
- C cannot exceed A. Meaning the retracement of AB cannot exceed 1.00
- C can be a 1.00 retracement of the AB leg, this is a rare pattern and a double top or bottom. Since strong moves can initiate from a double top or bottom, the pattern must be monitored for invalidation. (See Warning Signs below).
- D must exceed B in order for the pattern to complete at D and be a valid AB=CD.
- Severe Asymmetry in the slope and angle of the C-D leg compared to the A=B leg.
Warning Signs can signal a change in momentum in the C-D leg and can include:
- Long, wide range bars in the C-D leg, especially near the completion points
- Gaps in the C-D leg, especially near the completion points
- Asymmetry in price and time
Chart 12 illustrates a C-D leg with the warning signs listed above.
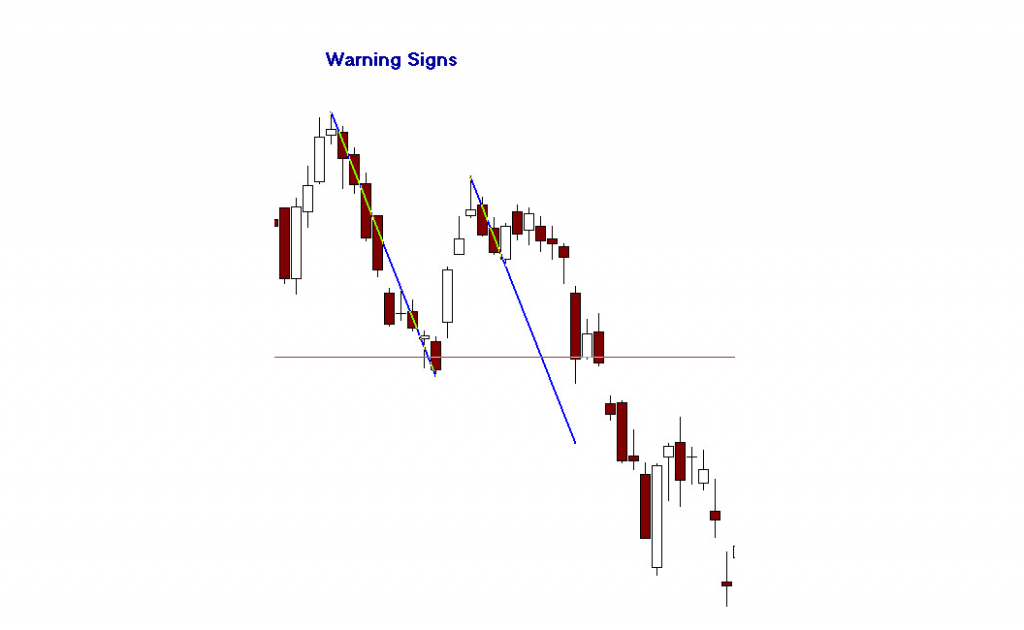
Chart 12 – Warning Signs in C-D leg: Gaps, Long Bars, Steep Slope
One of the interesting aspects of the AB=CD pattern is that there often are multiple patterns that form within a larger pattern. Identifying these smaller patterns can be of benefit in determining entry points.
Chart 13 and 14 show examples of multiple AB=CD patterns
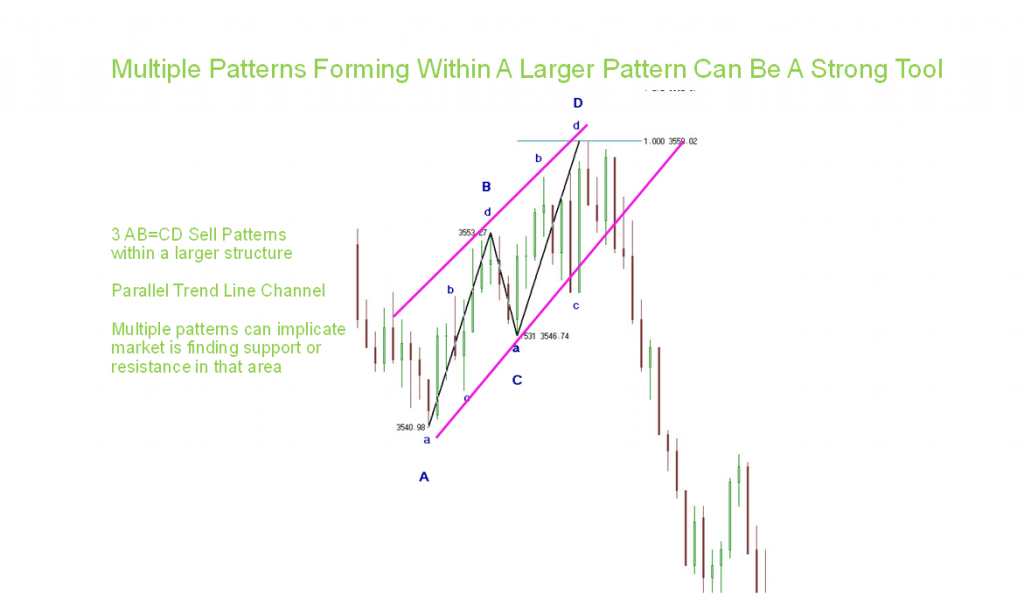
Chart 13 – Parallel Trend Line Channel with Multiple AB=CD Patterns
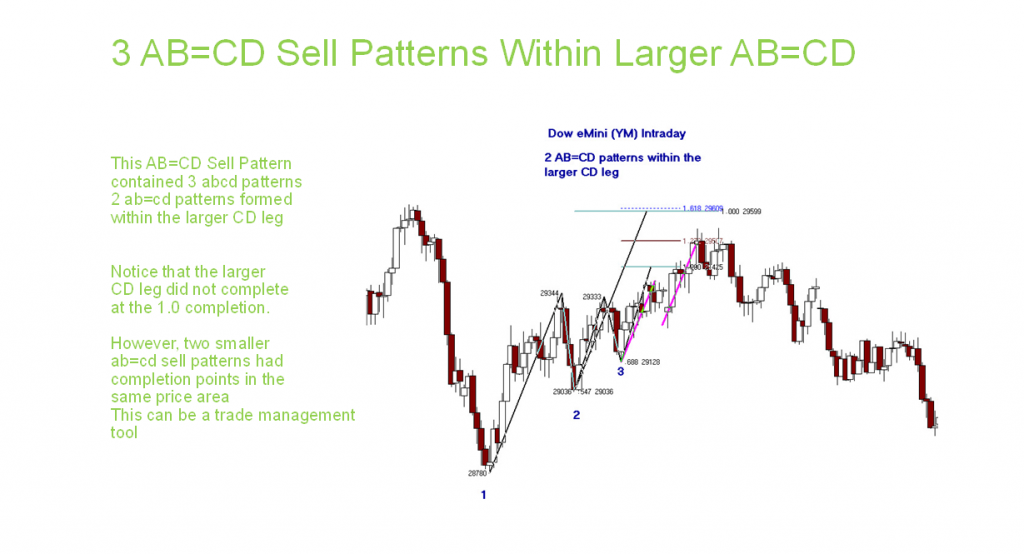
Chart 15 – Multiple AB=CD Patterns
Studying and learning this root, classic trading pattern has many advantages:
- Completion areas for potential trade entry points can be found in advance.
- Favorable risk/reward strategies can be formulated
- Exit strategies can be formulated using retracement levels and extension levels
- Risk can be controlled by assessing invalid extension points and utilizing other technical tools such as support and resistance.
Trading Ranges versus Trending Markets
Trading ranges and trends in markets are two separate environments and require different trading tactics, strategies, and approaches.
However, the AB=CD pattern can be traded in both environments. This pattern will test highs and lows and important areas of support and resistance within ranges. In trends, the AB=CD will be a corrective pattern. Below are chart examples of the AB=CD pattern in range trading and trend trading.
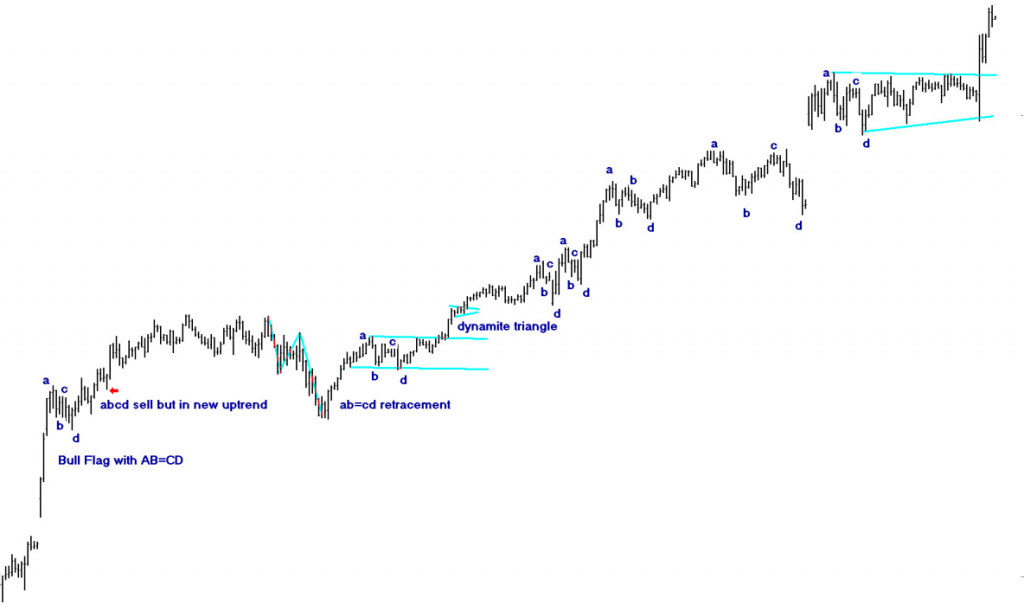
Chart 16 – AB=CD Corrective Patterns In Uptrend
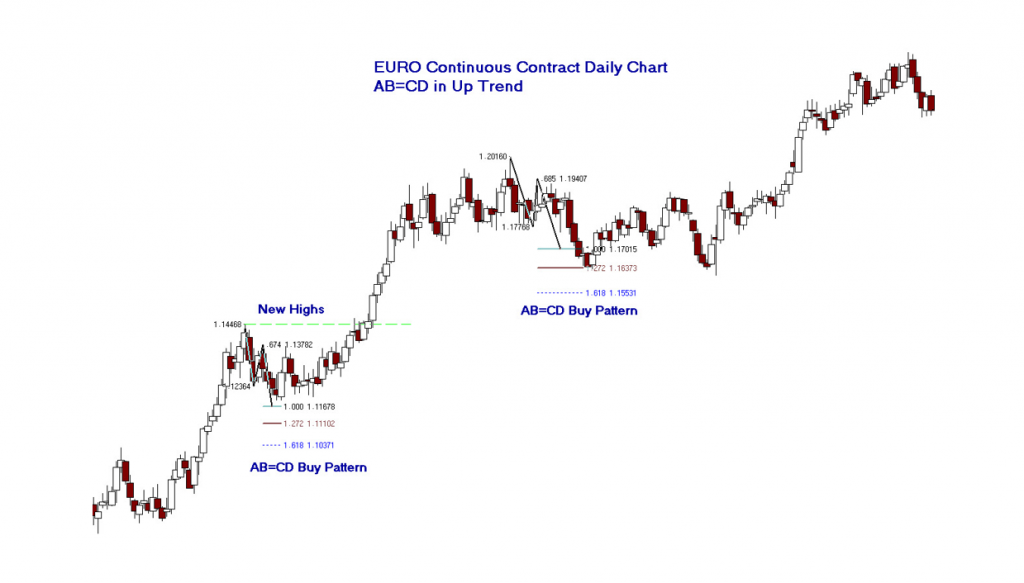
Chart 17 EURO Daily Chart AB=CD Buy Patterns In Up Trend
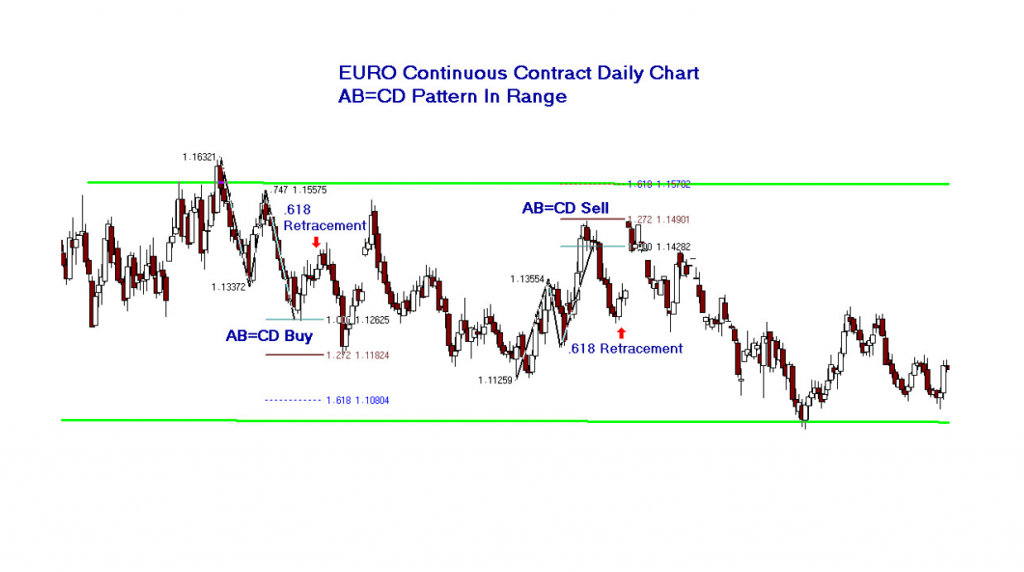
Chart 18 EURO Daily AB=CD Patterns In Range
Charts 16, 17 and 18 show examples of differences between trend versus range and the AB=CD pattern.
Patterns such as the AB=CD described in this article can be viable trading signals and solid trading plans developed. These patterns provide an opportunity to monitor in advance and determine acceptable risk/reward scenarios. Many trading strategies; intraday, swing trading and longer-term holds can all benefit from this classic pattern.
To further study this pattern and others you will find my 12Hour On-Demand course titled:
‘Mastering Stock/Futures FX Trading With Pattern Recognition’, at www.Udemy.com or visit my website at www.tradingliveonline.com for other educational materials.
Best wishes for successful trading,
Leslie Jouflas, CMT
Please note – Portions of this article have been excerpted from ‘Trade What You See, How to Profit From Pattern Recognition’ and ‘Mastering Stock/Futures FX Trading With Pattern Recognition’, all materials are copy write protected.
Ten-minute video of stocks I presented for StockCharts.com on September 8, 2021, as trading setups that were at buy points. The focus was on Energy stocks using my technical analysis and specific pattern recognition setups; The AB=CD and Gartley buy patterns.AAPL stock was also a trading setup with a sell pattern.
Best wishes for successful trading,
- « Previous
- 1
- 2
- 3
- 4