History of AB=CD Pattern, by Leslie Jouflas, CMT
Originally published in Bombay Stock Exchange Brokers Forum (BBF) Mumbai, India April 2021 Volume 10 – Issue NO.1
H.M Gartley published his classic book on technical analysis in 1935, ‘Profits in the Stock Market’. The book was a course in trading and sold for $1500 to investors. The book is 446 pages and includes a packet of reproduction charts hand-drawn from the 1800s to 1935.
It is a treasure for any technical analyst or student of the financial markets as a reference book in their trading library.
On page 249 Gartley describes a chart pattern, “Practical Use of Trend Lines”.
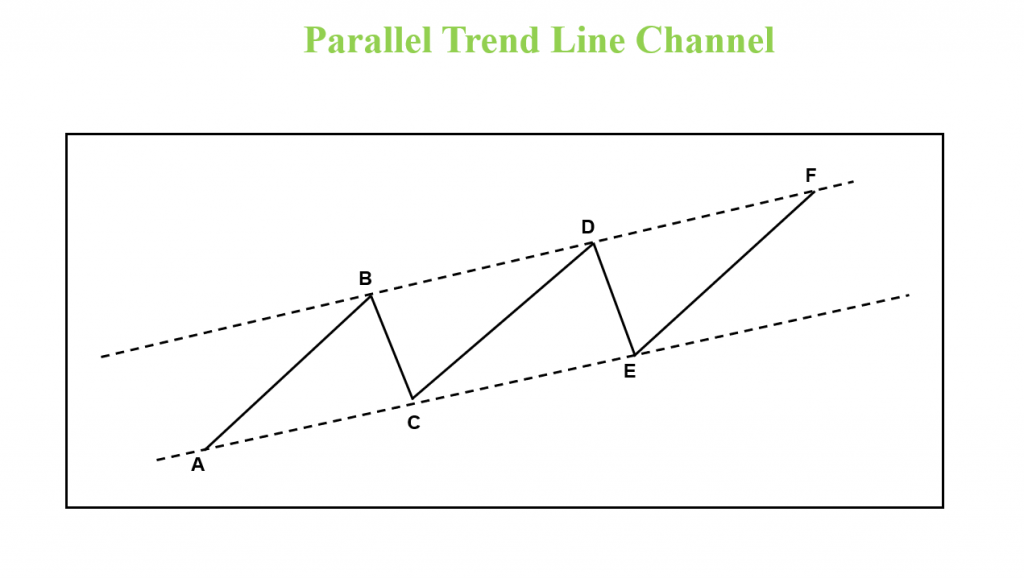
Chart 1 – Upward Sloping Parallel Trend Line Channel
Within a Parallel Trend Line Channel, the AB=CD pattern is formed by price rallies and declines bound within an upper and lower trend line. These patterns can be up sloping, downsloping or horizontal.
The swings are labeled A, B, C, D, E, F in the illustration. This is the basis of the AB=CD trading pattern.
(See Chart 2)
H.M. Gartley never used or referred to specific Fibonacci ratios, however, he did refer to retracements in terms of one-third, two-thirds, or one-half.
The AB=CD pattern is the root pattern of the Gartley 222, Butterfly, and is also found in the 3 Drives pattern.
It is imperative that traders learn and study the correct structure and variations of this pattern before learning the other patterns mentioned.
In 1976 Larry Pesavento was the first trader to implement Fibonacci ratios and apply them to the AB=CD and Gartley 222 pattern, which is a retracement pattern containing the AB=CD pattern.
The Fibonacci ratios and extension ratios bring structure to the identification of these patterns and can be valuable in identifying failed or invalid patterns. The pattern has the shape of a “Lightning Bolt”, remembering this shape will help traders study this pattern on price charts.
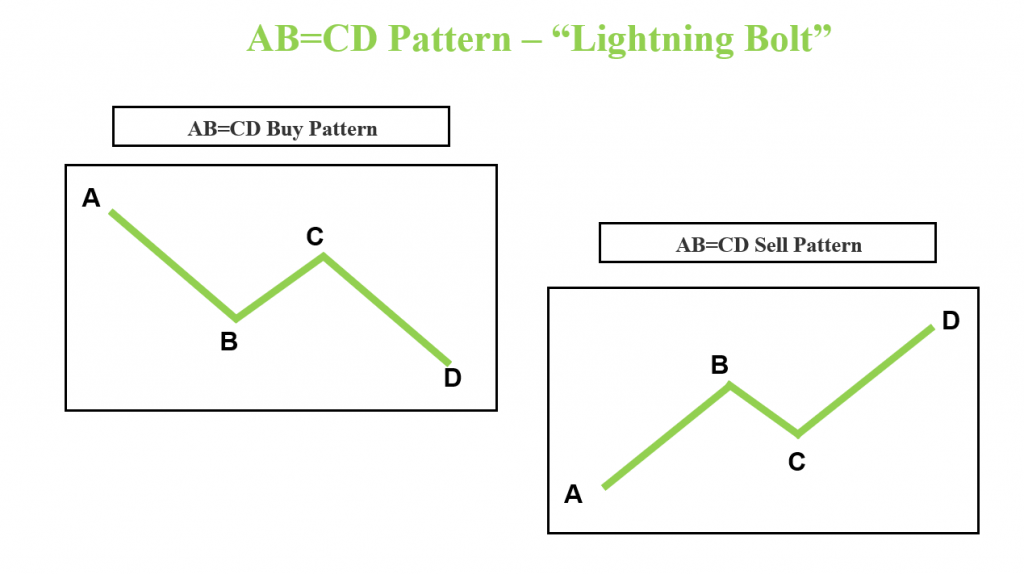
Chart 2 – Line Drawing Example of AB=CD Buy Pattern and AB=CD Sell Pattern
AB=CD Structure
The AB=CD pattern forms in all markets and all time frames. There are three waves (legs) that form this pattern;
- Wave 1 is labeled A-B
- Wave 2 is labeled B-C
- Wave 3 is labeled C-D
After the completion of the first leg (A-B) a retracement or corrective wave will form (B-C) and can retrace within a range of the A-B leg from .382, .50, .618, .786, .886, and even to the 1.0 of the A-B wave. Please note, a B-C retracement that exceeds the A point will invalidate the pattern.
Often the A-B and the C-D legs will be equal in length. However, a variation of the C-D leg can be extended and be longer than the A-B leg. These are the Fibonacci ratios I use most frequently for the CD leg extensions:
- 1.27
- 1.618
There are times that the C-D leg extension will exceed 1.618 but generally beyond the 2.0 extension (2 times the length of A-B) is considered an invalid pattern structure.
Chart 3 below shows an example of the Fibonacci retracements and the Fibonacci extension ratios of the C-D leg.
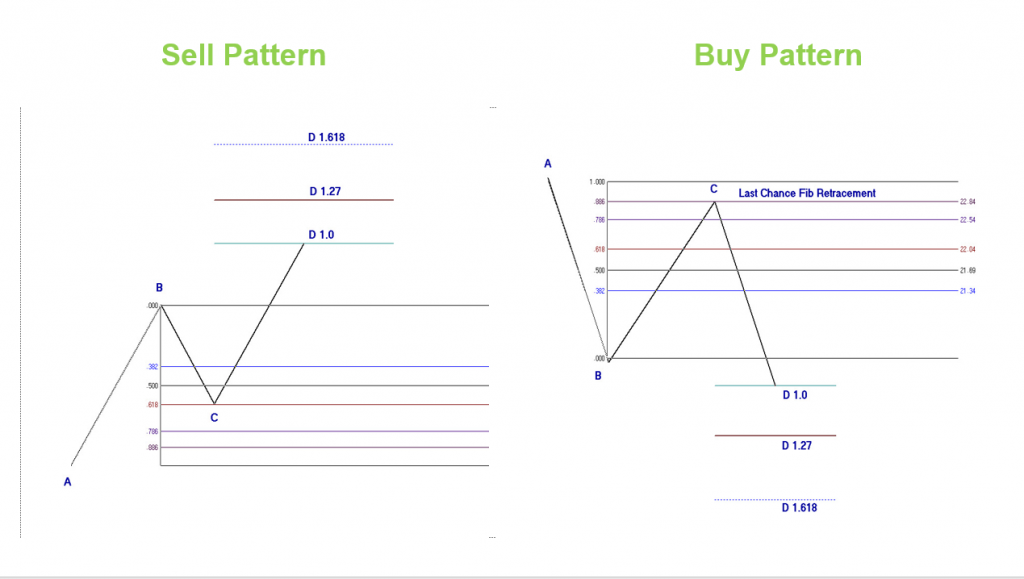
Chart 3 – Example of Fibonacci Retracement Ratios and Fibonacci Extension Ratios
I refer to the .886 retracement level as the “Last Chance Fib Retracement”. Generally, when a market has a close beyond the .886 it will move to the 1.0 or further. It is the “Last Chance” for the market to complete the correction and move in the opposite direction.
Although the 1.0 is considered valid as a retracement, most technical analysts will recognize this as a double top or double bottom pattern. This should be kept in mind when analyzing a potential AB=CD pattern that has a retracement at this level. The market should then be monitored for strength or weakness from that retracement.
Calculating the Fibonacci Extension Ratios
My charting tool, provided by Ensign Software, will project the Fibonacci retracement and extension ratios as a pattern is forming. This way I can monitor the pattern as it forms and be aware of the potential completion areas. I refer to a C-D leg that is equal to the A-B leg as the 1.0 completion. For C-D legs that extend to a 1.27 or 1.618, I refer to those as;
- 1.27 D completion point
- 1.618 D completion point
If you have a Fibonacci tool that you can input those ratios you will be able to use that to find those completion points. It is an easy calculation to find the C-D Fibonacci extensions and is as follows;
To find the 1.27 Fibonacci extension ratio take the length of A-B and multiply by 1.27. Add to the low of C for a sell pattern and subtract from C for a buy pattern.
- A-B = 10 points
- 10 points x 1.27 = 12.7
- Add 12.7 to the low of C (Sell pattern) or subtract from high of C (Buy pattern) = projected 1.27 D completion
The same calculation can be used for a 1.618 D completion point.
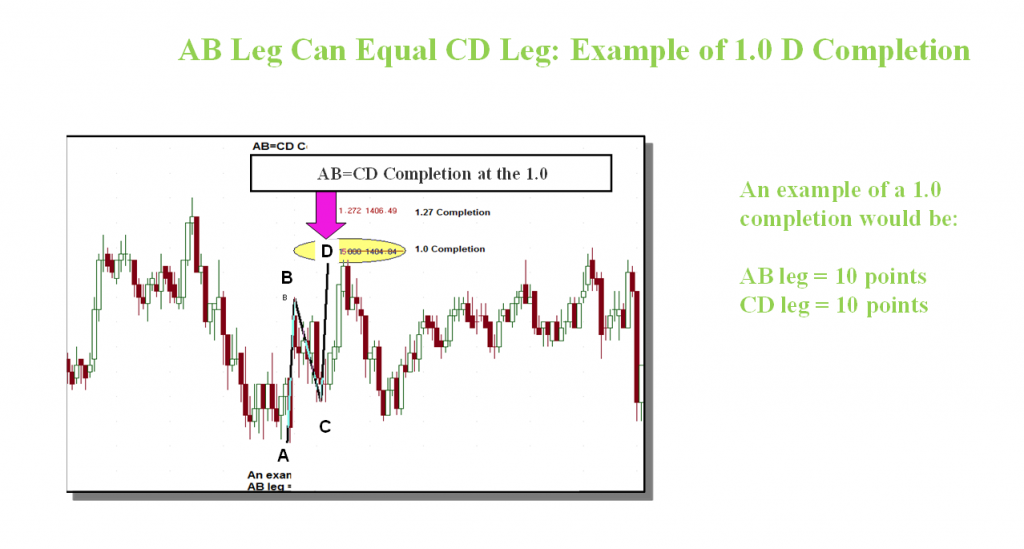
Chart 4 – Example of 1.0 D Completion
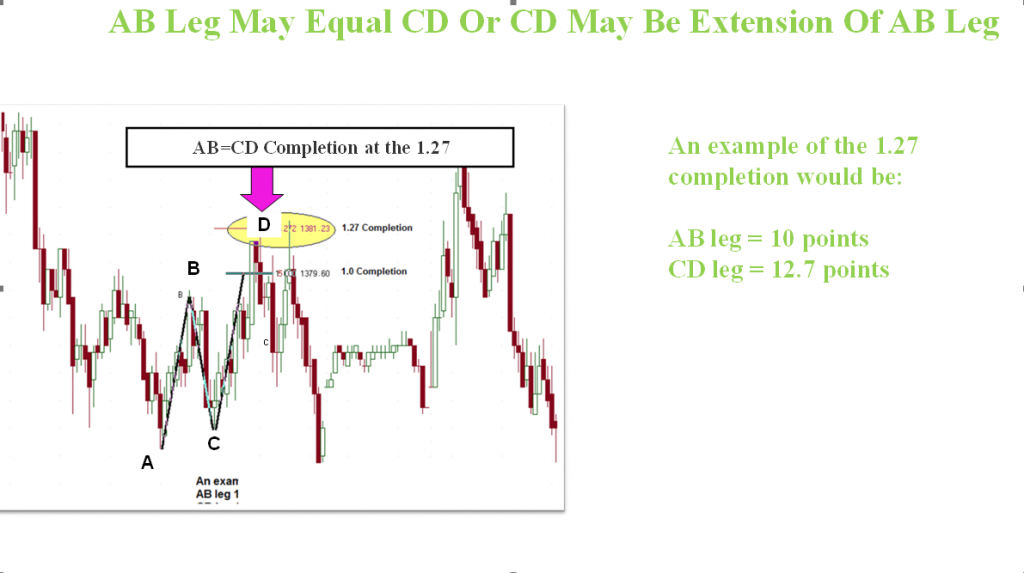
Chart 5 – Example of 1.27 D Completion
Calculating the B-C leg extension can also be helpful in determining confluence into the C-D leg pattern completion areas. It is calculated using the same method as discussed above.
Chart 6A below is an example of the AB=CD pattern drawing and labeling of ratios.
Chart 6B below is another example showing the Fibonacci retracements, extension ratios, and the B-C extension. Note also in Chart 6B the Parallel Trend Line Channel discussed earlier in this article.
Using the first pattern on the left you will see the B-C extension ratio labeled 1.27.
Length of B-C x 1.27 added to the low of C.
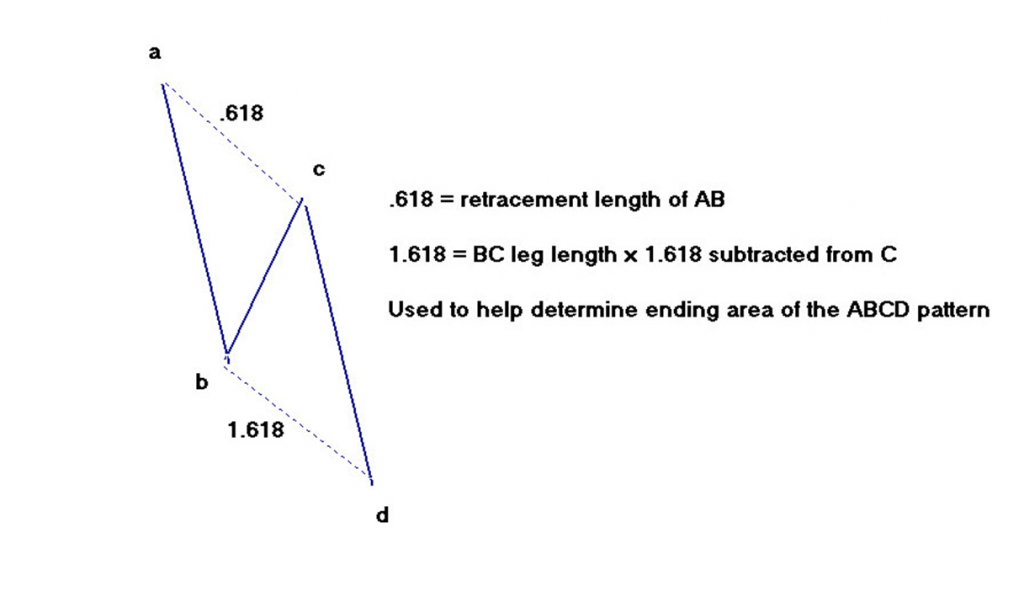
Chart 6A – Example of AB=CD Buy Pattern Labeling
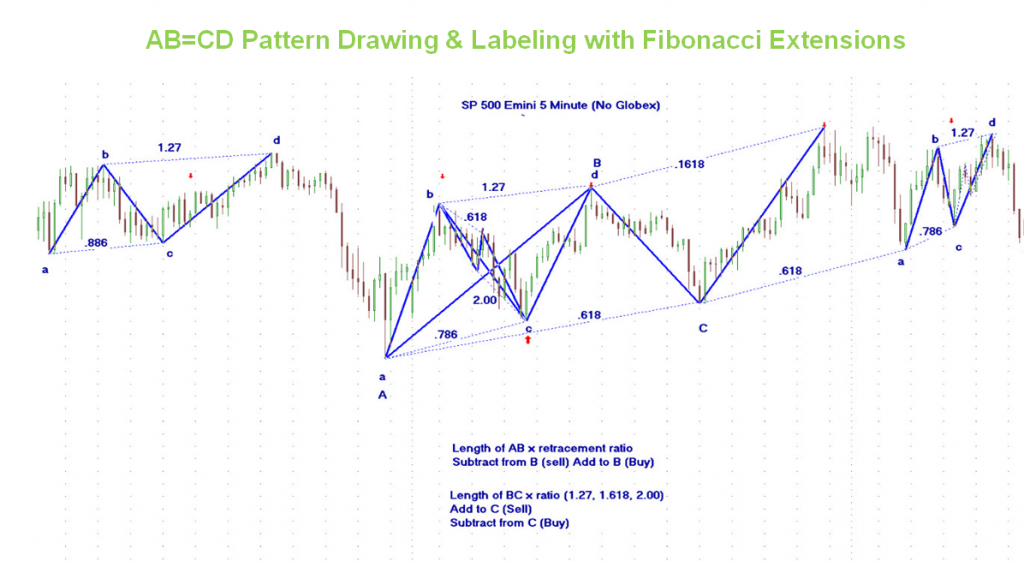
Chart 6B – Examples of B-C Fibonacci Extensions and Parallel Trend Line Channel
Symmetry, Pattern Invalidations and Warning Signs
Symmetry is important to study with the AB=CD and the other related patterns. The symmetrical or asymmetrical formation of the A-B and C-D legs can be clues. (See Chart 7 below)
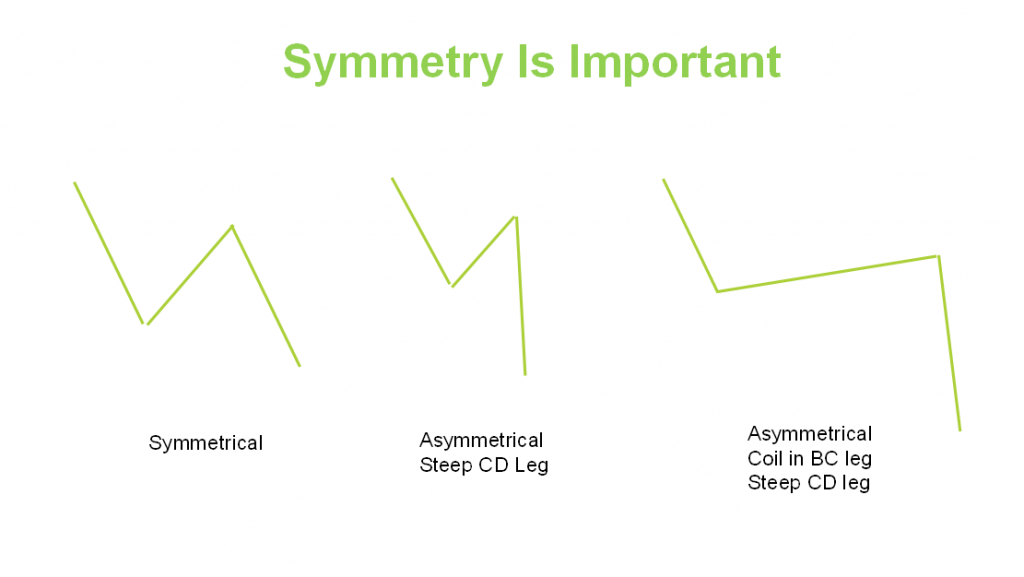
Chart 7 – Illustration of Symmetrical versus Asymmetrical Pattern Formations
In general the A-B and C-D legs should be similar in slope and angle. Long, wide-ranging bars that form in the C-D leg can be an indication that a stronger move is in progress and that a trend may be in progress.
The long, wide-ranging bars can also indicate the price may complete at one of the Fibonacci extension ratios discussed earlier.
Chart 8 below shows an example of an asymmetrical C-D leg compared to A-B. Also, note the long coil formation in the B-C leg.
The C-D leg clearly shows long, wide range bars at a steeper slope and angle than the A-B leg.
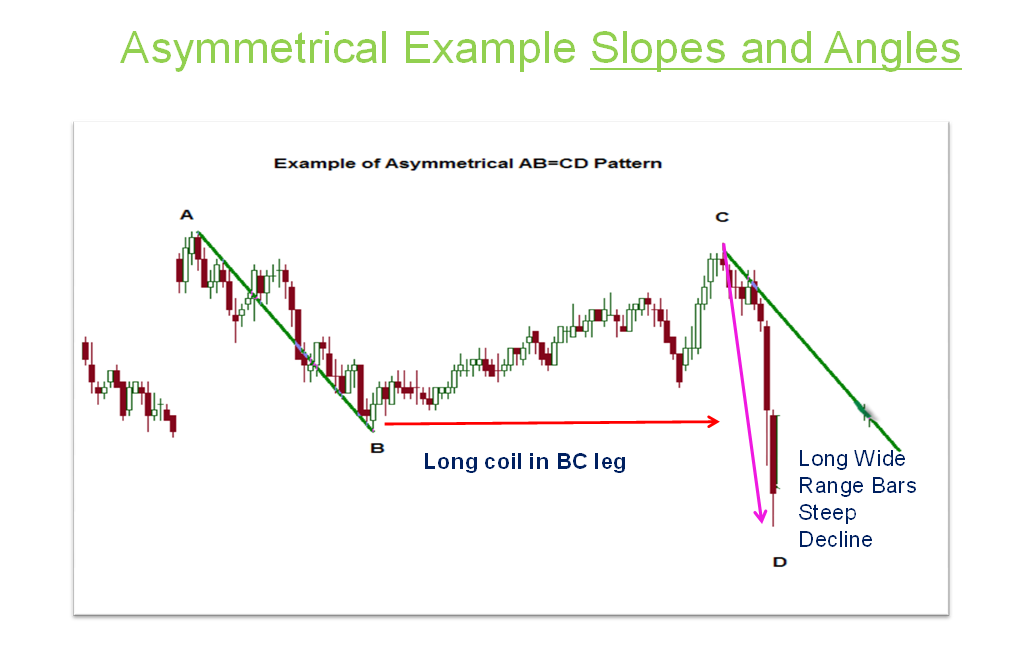
Chart 8 – Example of Asymmetrical Slope and Angle with Long Wide Range Bars
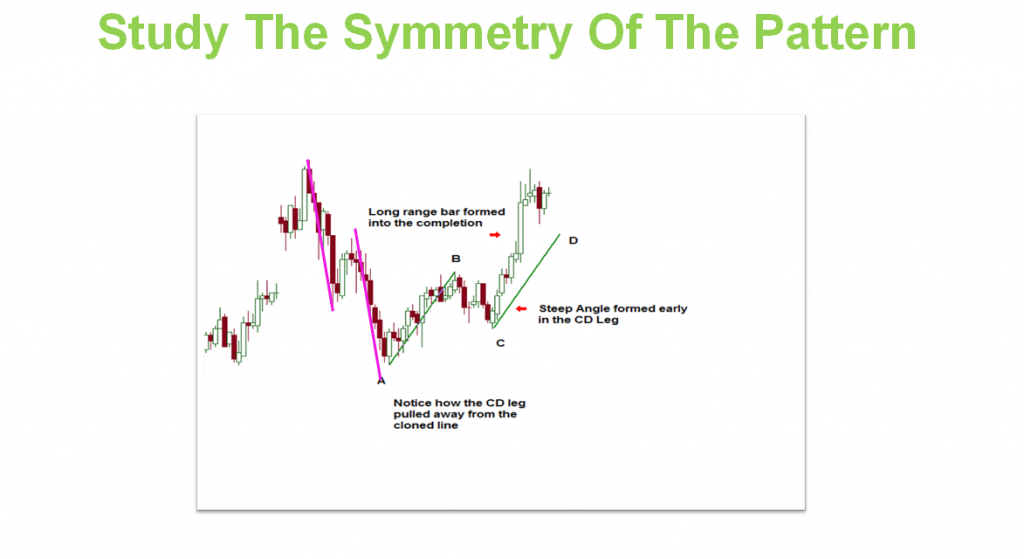
Chart 9 – Example of Steep Slope and Angle C-D Leg
Time symmetry is another element in the structure to study. This is covered more in-depth in my course listed at the end of this article. However, briefly, there should be approximately the same number, or ratio, of bars in the A-B and C-D legs.
See chart 10 and chart 11 below for examples
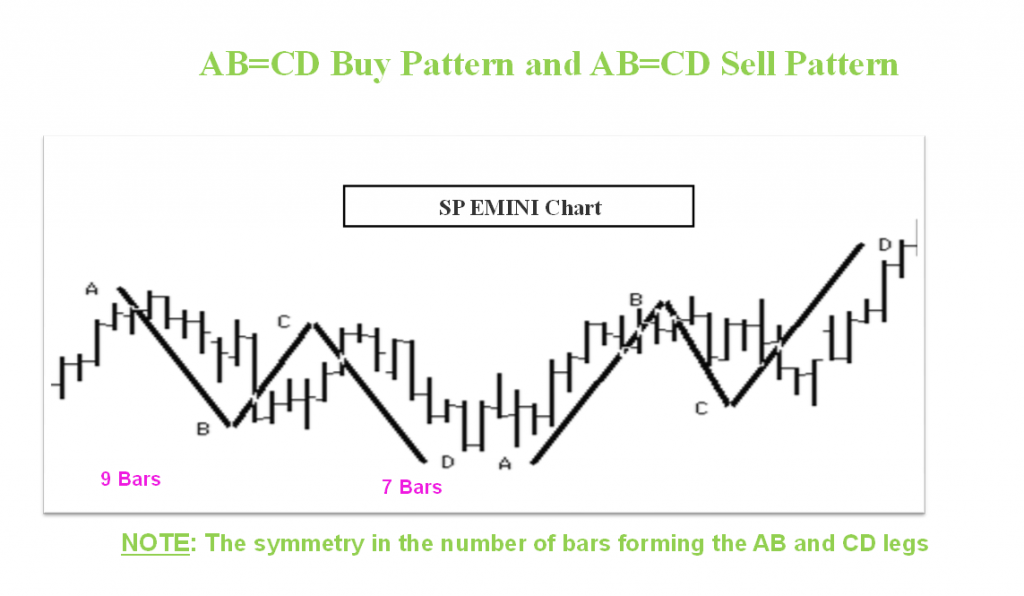
Chart 10 – Example of Time Symmetry
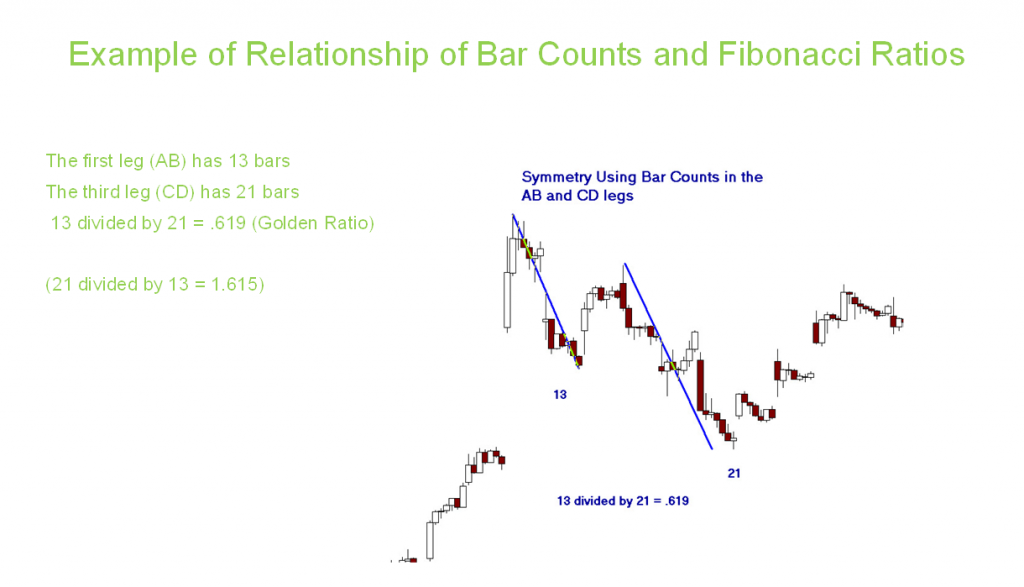
Chart 11 – Example of Time Symmetry and Fibonacci Relationship
Pattern invalidations
There are several main items that may invalidate the AB=CD pattern structure. It takes time and chart study to recognize these as part of a pattern formation and know when to avoid the pattern.
- C cannot exceed A. Meaning the retracement of AB cannot exceed 1.00
- C can be a 1.00 retracement of the AB leg, this is a rare pattern and a double top or bottom. Since strong moves can initiate from a double top or bottom, the pattern must be monitored for invalidation. (See Warning Signs below).
- D must exceed B in order for the pattern to complete at D and be a valid AB=CD.
- Severe Asymmetry in the slope and angle of the C-D leg compared to the A=B leg.
Warning Signs can signal a change in momentum in the C-D leg and can include:
- Long, wide range bars in the C-D leg, especially near the completion points
- Gaps in the C-D leg, especially near the completion points
- Asymmetry in price and time
Chart 12 illustrates a C-D leg with the warning signs listed above.
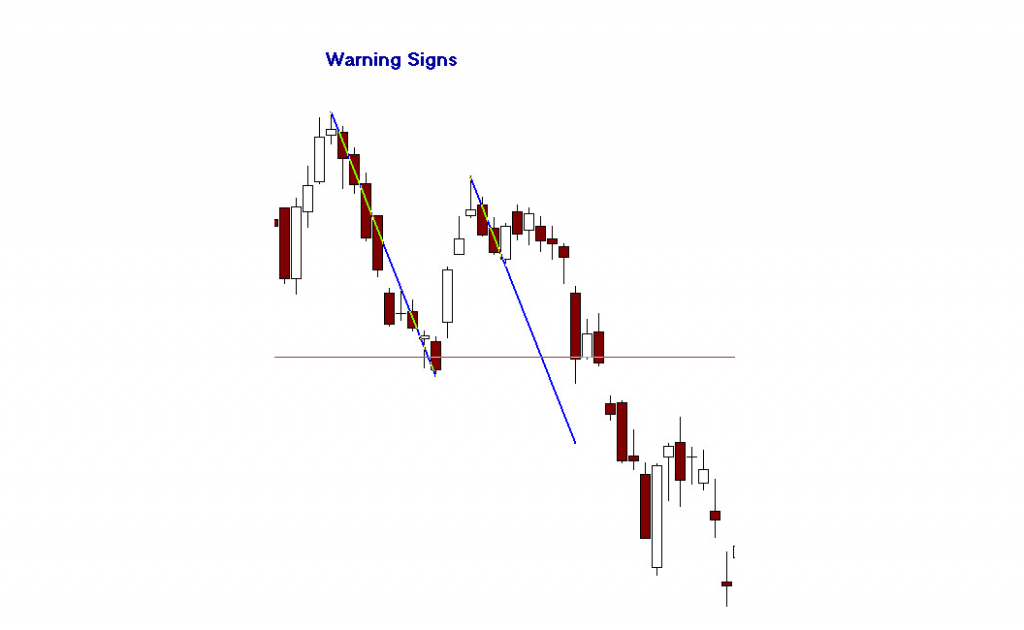
Chart 12 – Warning Signs in C-D leg: Gaps, Long Bars, Steep Slope
One of the interesting aspects of the AB=CD pattern is that there often are multiple patterns that form within a larger pattern. Identifying these smaller patterns can be of benefit in determining entry points.
Chart 13 and 14 show examples of multiple AB=CD patterns
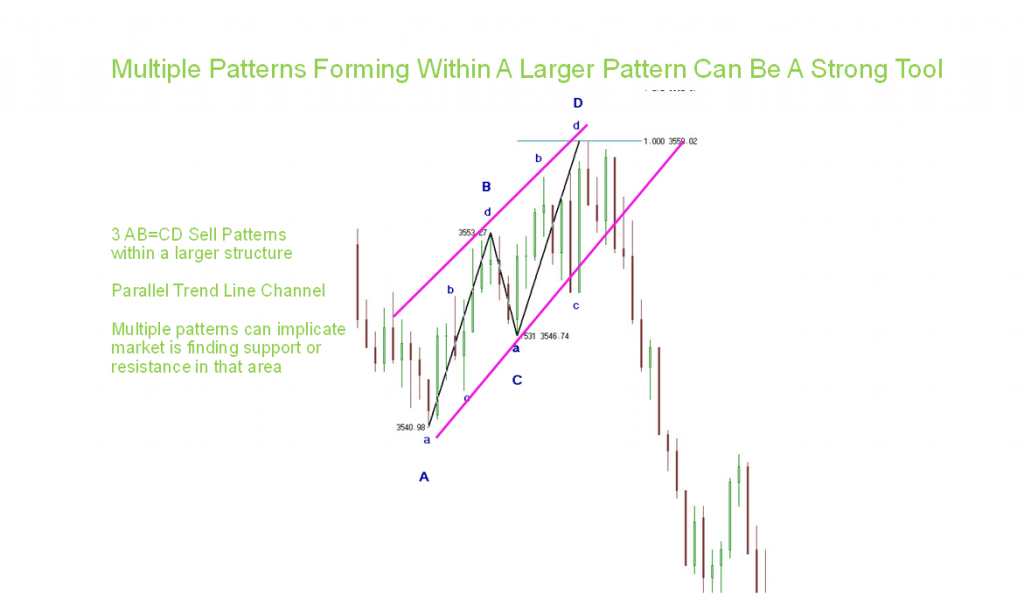
Chart 13 – Parallel Trend Line Channel with Multiple AB=CD Patterns
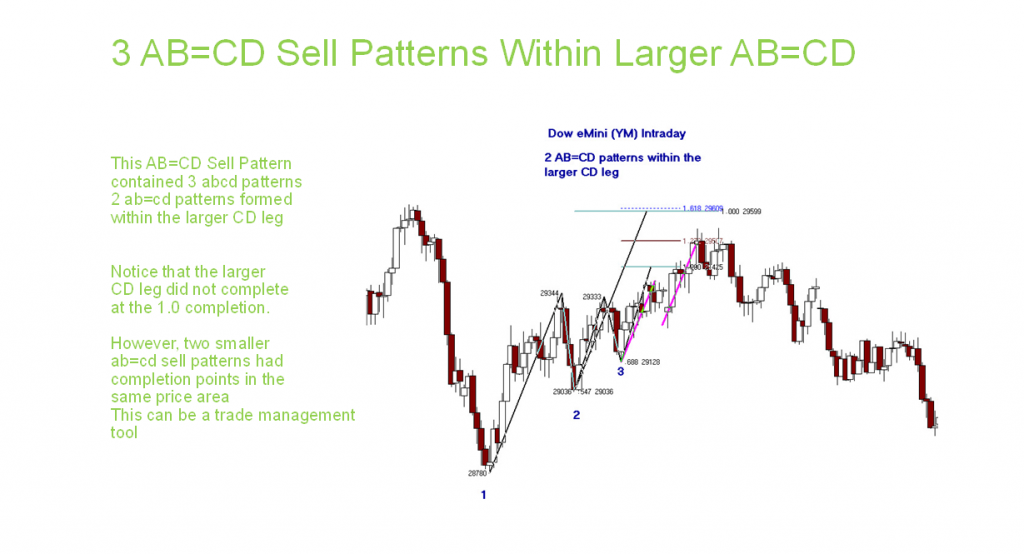
Chart 15 – Multiple AB=CD Patterns
Studying and learning this root, classic trading pattern has many advantages:
- Completion areas for potential trade entry points can be found in advance.
- Favorable risk/reward strategies can be formulated
- Exit strategies can be formulated using retracement levels and extension levels
- Risk can be controlled by assessing invalid extension points and utilizing other technical tools such as support and resistance.
Trading Ranges versus Trending Markets
Trading ranges and trends in markets are two separate environments and require different trading tactics, strategies, and approaches.
However, the AB=CD pattern can be traded in both environments. This pattern will test highs and lows and important areas of support and resistance within ranges. In trends, the AB=CD will be a corrective pattern. Below are chart examples of the AB=CD pattern in range trading and trend trading.
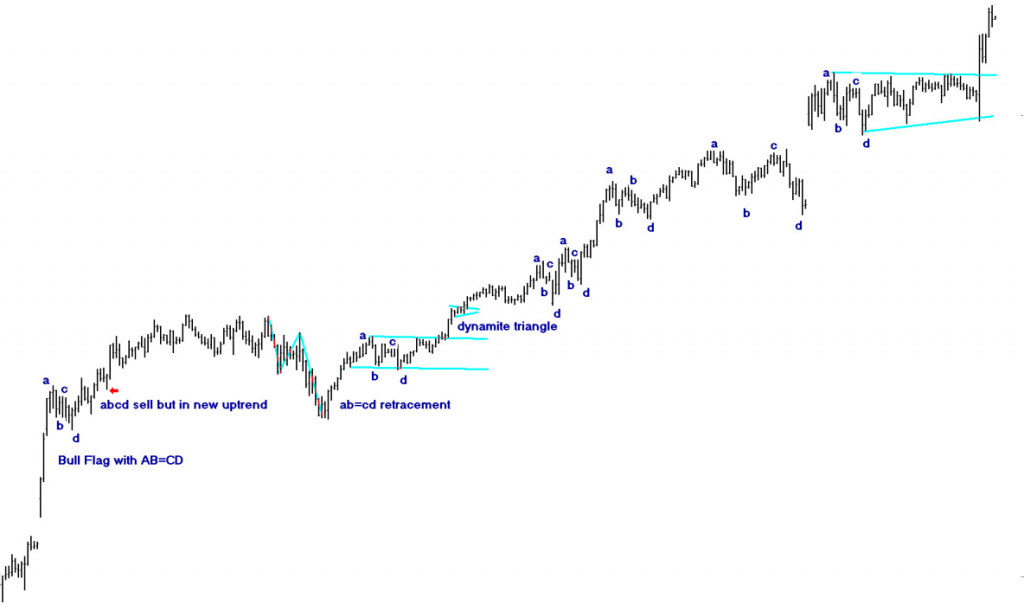
Chart 16 – AB=CD Corrective Patterns In Uptrend
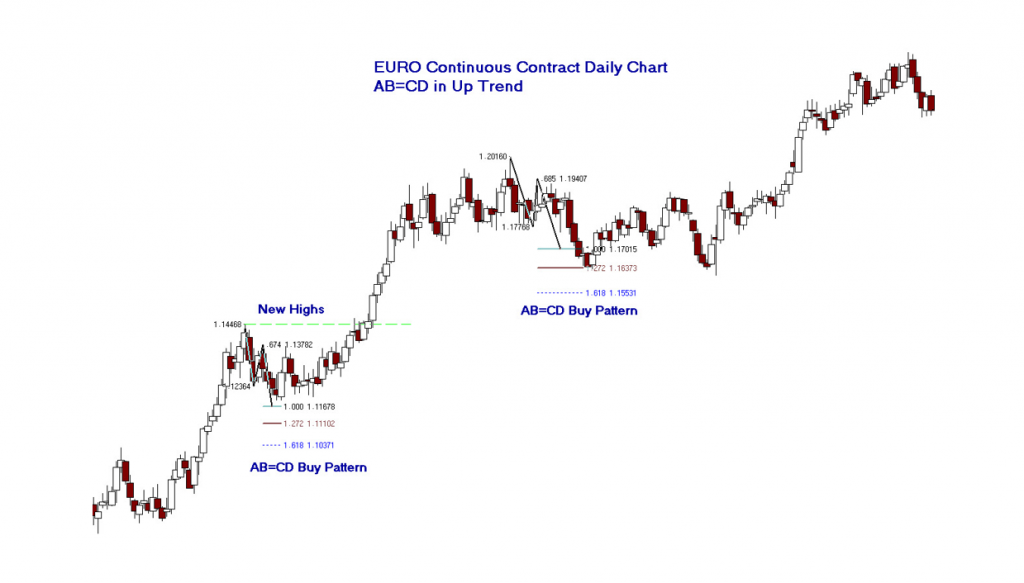
Chart 17 EURO Daily Chart AB=CD Buy Patterns In Up Trend
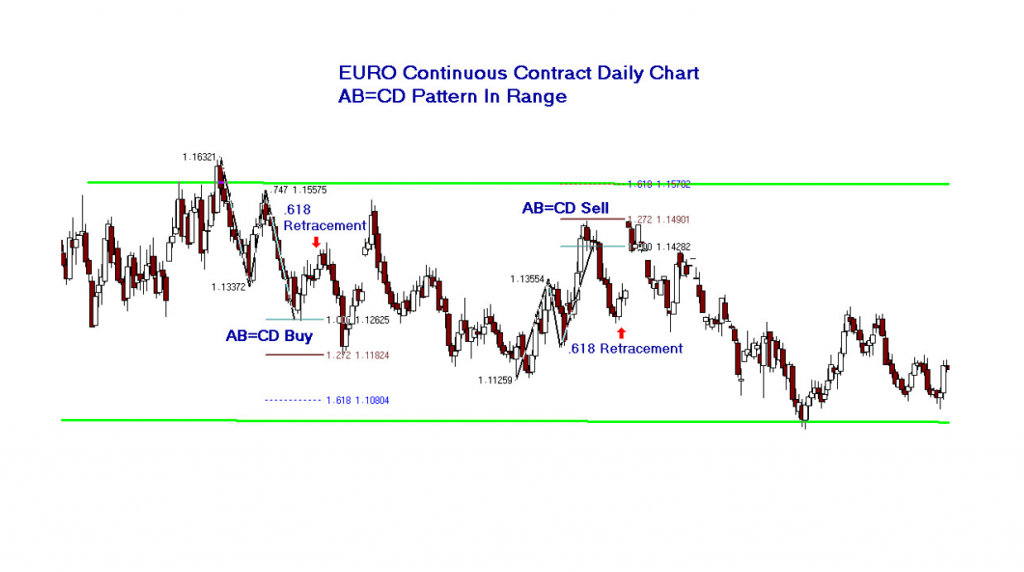
Chart 18 EURO Daily AB=CD Patterns In Range
Charts 16, 17 and 18 show examples of differences between trend versus range and the AB=CD pattern.
Patterns such as the AB=CD described in this article can be viable trading signals and solid trading plans developed. These patterns provide an opportunity to monitor in advance and determine acceptable risk/reward scenarios. Many trading strategies; intraday, swing trading and longer-term holds can all benefit from this classic pattern.
To further study this pattern and others you will find my 12Hour On-Demand course titled:
‘Mastering Stock/Futures FX Trading With Pattern Recognition’, at www.Udemy.com or visit my website at www.tradingliveonline.com for other educational materials.
Best wishes for successful trading,
Leslie Jouflas, CMT
Please note – Portions of this article have been excerpted from ‘Trade What You See, How to Profit From Pattern Recognition’ and ‘Mastering Stock/Futures FX Trading With Pattern Recognition’, all materials are copy write protected.